Edit chart
Loading graph
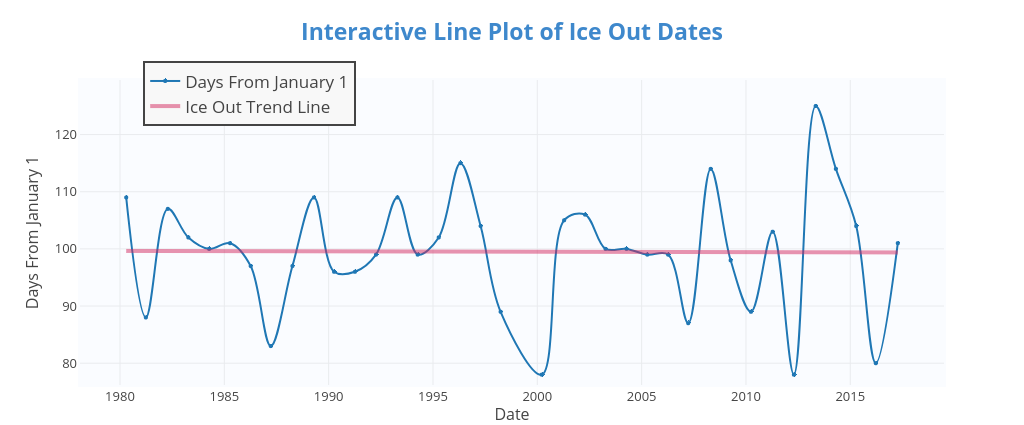
Bigroundpine's interactive graph and data of "Interactive Line Plot of Ice Out Dates" is a line chart, showing Days From January 1 vs Ice Out Trend Line; with Date in the x-axis and Days From January 1 in the y-axis.. The x-axis shows values from 1978-01-31 06:15:06.9984 to 2019-06-29 17:44:53.0016. The y-axis shows values from 76.18704512372634 to 129.5494905385735.