Edit chart
Loading graph
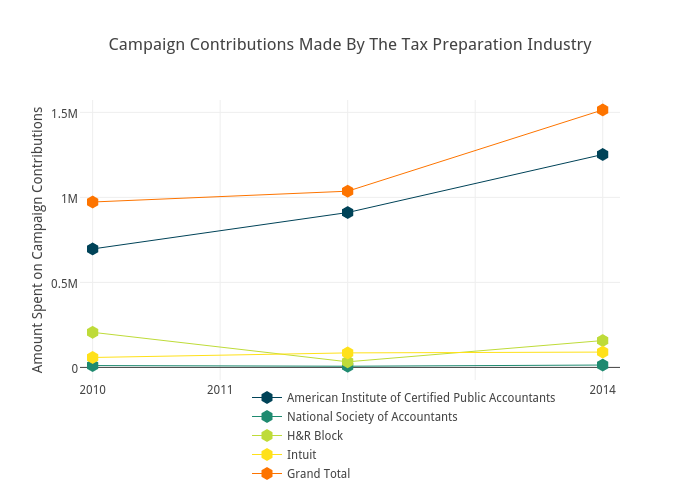
Brethendry's interactive graph and data of "Campaign Contributions Made By The Tax Preparation Industry" is a scatter chart, showing American Institute of Certified Public Accountants, National Society of Accountants, H&R Block, Intuit, Grand Total; with Election Cycle in the x-axis and Amount Spent on Campaign Contributions in the y-axis.. The x-axis shows values from 2009.9009354917475 to 2014.135477532729. The y-axis shows values from -73973.77072215613 to 1572722.3853535585.