Edit chart
Loading graph
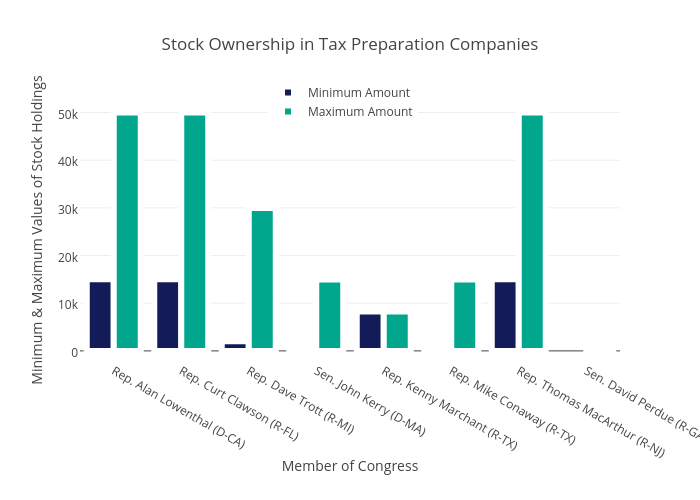
Brethendry's interactive graph and data of "Stock Ownership in Tax Preparation Companies" is a bar chart, showing Minimum Amount vs Maximum Amount; with Member of Congress in the x-axis and Minimum & Maximum Values of Stock Holdings in the y-axis.. The x-axis shows values from -0.5 to 7.5. The y-axis shows values from -1914.201453161484 to 52631.57894736842.