Edit chart
Loading graph
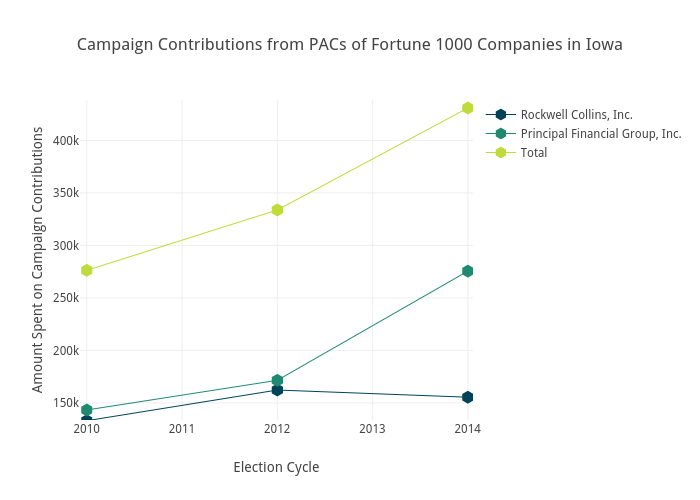
Brethendry's interactive graph and data of "Campaign Contributions from PACs of Fortune 1000 Companies in Iowa" is a scatter chart, showing Rockwell Collins, Inc., Principal Financial Group, Inc., Total; with Election Cycle in the x-axis and Amount Spent on Campaign Contributions in the y-axis.. The x-axis shows values from 2009.9292010633833 to 2014.0540086749684. The y-axis shows values from 133692.75125354264 to 438503.3028122956.