Edit chart
Loading graph
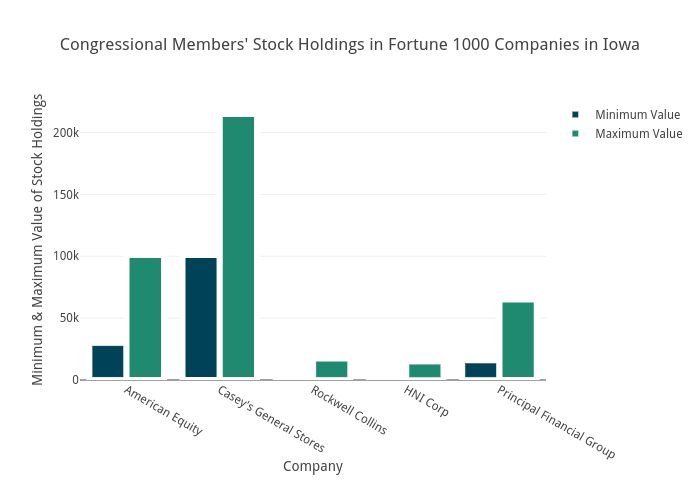
Brethendry's interactive graph and data of "Congressional Members' Stock Holdings in Fortune 1000 Companies in Iowa" is a bar chart, showing Minimum Value vs Maximum Value; with Company in the x-axis and Minimum & Maximum Value of Stock Holdings in the y-axis.. The x-axis shows values from -0.5 to 4.5. The y-axis shows values from 0 to 226315.7894736842.