Edit chart
Loading graph
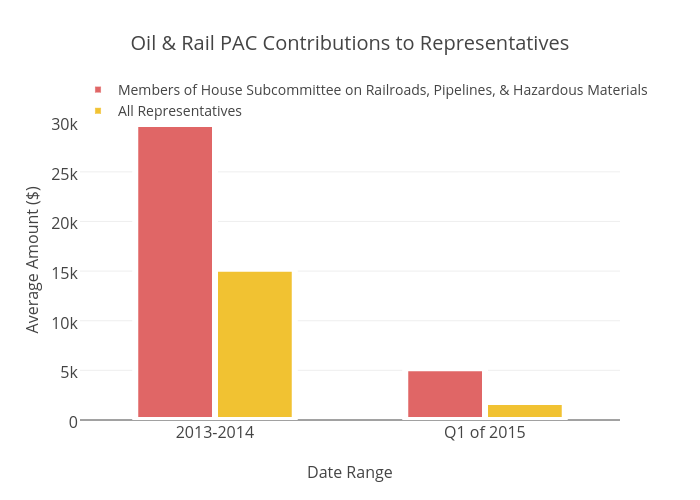
Brethendry's interactive graph and data of "Oil & Rail PAC Contributions to Representatives" is a bar chart, showing Members of House Subcommittee on Railroads, Pipelines, & Hazardous Materials vs All Representatives; with Date Range in the x-axis and Average Amount ($) in the y-axis.. The x-axis shows values from -0.5 to 1.5. The y-axis shows values from 0 to 32232.63157894737.