Edit chart
Loading graph
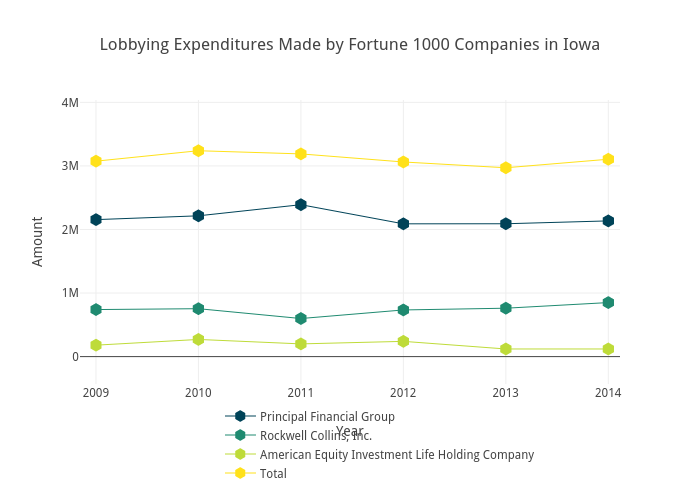
Brethendry's interactive graph and data of "Lobbying Expenditures Made by Fortune 1000 Companies in Iowa" is a scatter chart, showing Principal Financial Group, Rockwell Collins, Inc., American Equity Investment Life Holding Company, Total; with Year in the x-axis and Amount in the y-axis.. The x-axis shows values from 2008.8439852768947 to 2014.1141877195919. The y-axis shows values from -431057.4989947729 to 4036976.27663852.