Edit chart
Loading graph
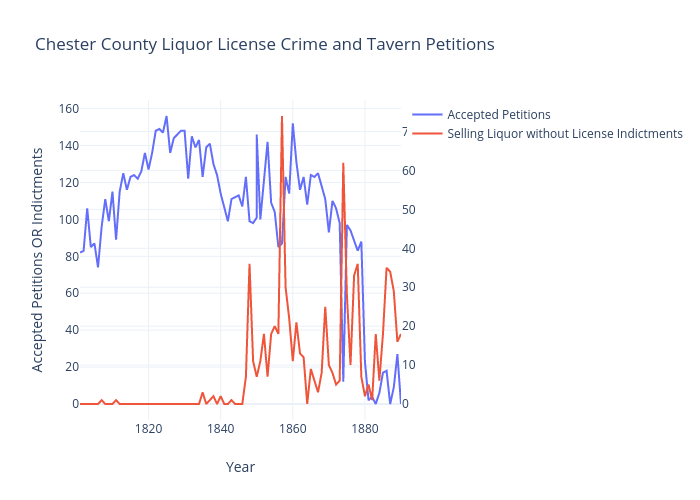
Ccarchives's interactive graph and data of "Chester County Liquor License Crime and Tavern Petitions" is a line chart, showing Accepted Petitions vs Selling Liquor without License Indictments; with Year in the x-axis and Accepted Petitions OR Indictments in the y-axis.. The x-axis shows values from 1801 to 1890. The y-axis shows values from -8.666666666666668 to 164.66666666666666.