Edit chart
Loading graph
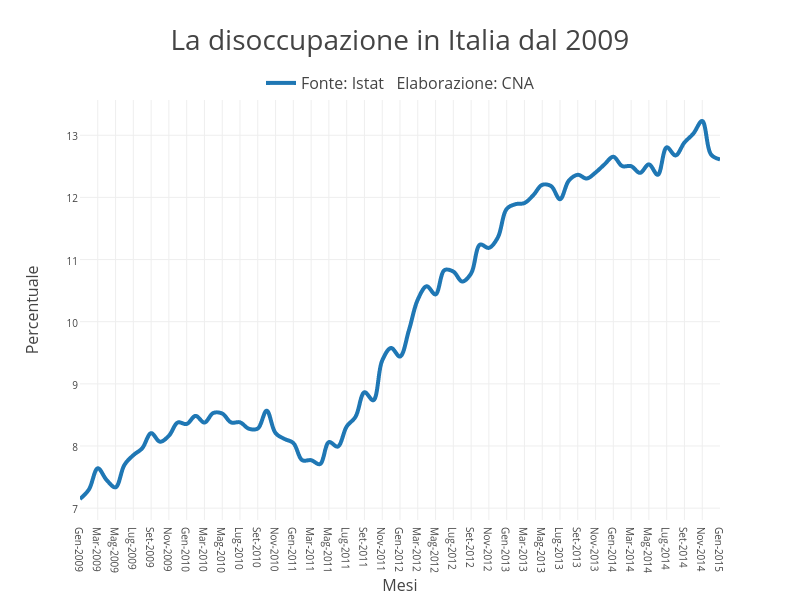
Cna's interactive graph and data of "La disoccupazione in Italia dal 2009" is a scatter chart, showing Fonte: Istat Elaborazione: CNA; with Mesi in the x-axis and Percentuale in the y-axis.. The x-axis shows values from 0 to 72. The y-axis shows values from 6.808656388888889 to 13.566988611111112.