Edit chart
Loading graph
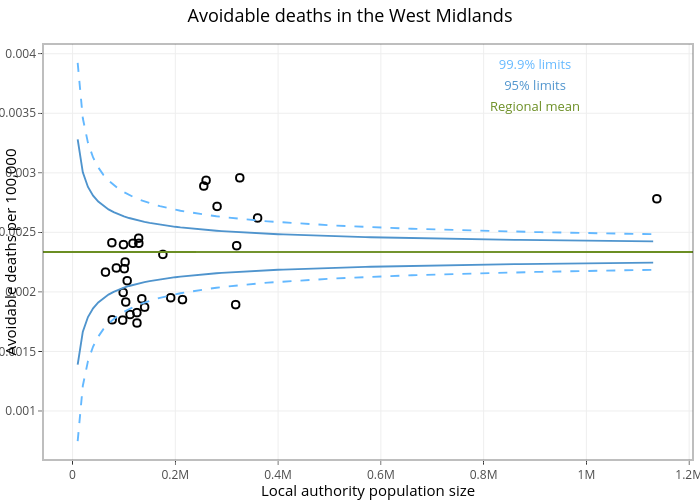
Carmenaguilar's interactive graph and data of "Avoidable deaths in the West Midlands" is a scatter chart; with Local authority population size in the x-axis and Avoidable deaths per 100,000 in the y-axis.. The x-axis shows values from -57500 to 1207500. The y-axis shows values from 0.000588302110247167 to 0.00408178256135945.