Edit chart
Loading graph
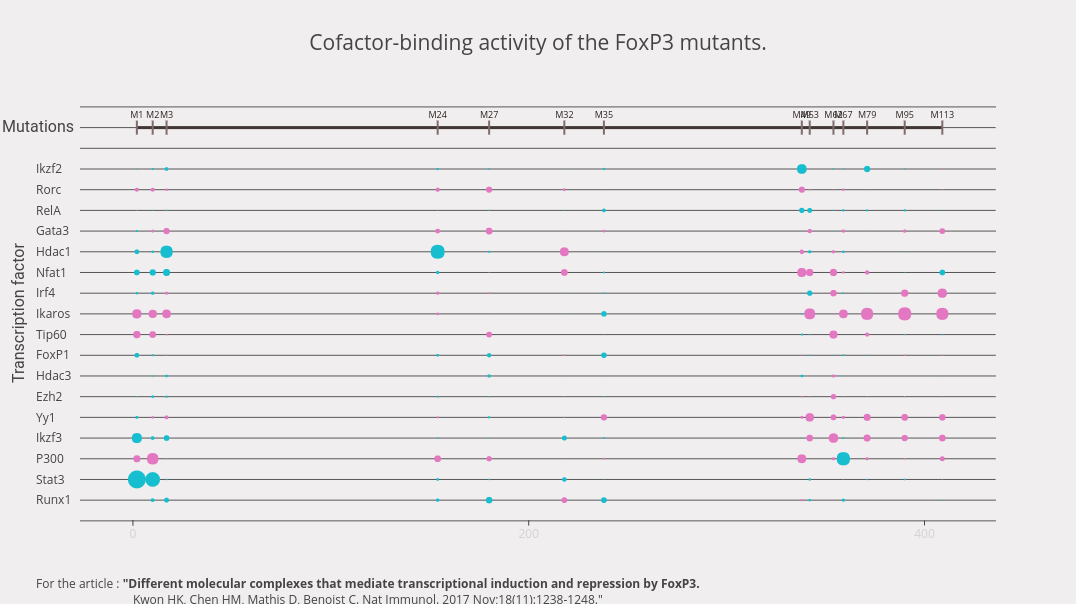
Catherinelaplace's interactive graph and data of "Cofactor-binding activity of the FoxP3 mutants." is a scatter chart, showing C, C, F, F, I, I, L, L, O, O, R, R, U, U, X, X, AA, AA, AD, AD, AG, AG, AJ, AJ, AM, AM, AP, AP, AS, AS, AV, AV, AY, AY, BE; with in the x-axis and in the y-axis.. The x-axis shows values from -26.753032794514596 to 435.9220315844994. The y-axis shows values from -1.2209536601746138 to 19.329751511081263. This visualization has the following annotations: Mutations; Runx1; Stat3; P300; Ikzf3; Yy1; Ezh2; Hdac3; FoxP1; Tip60; Ikaros; Irf4; Nfat1; Hdac1; Gata3; RelA; Rorc; Ikzf2; For the article : "Different molecular complexes that mediate transcriptional induction and repression by FoxP3.Kwon HK, Chen HM, Mathis D, Benoist C. Nat Immunol. 2017 Nov;18(11):1238-1248."; Transcription factor