Edit chart
Loading graph
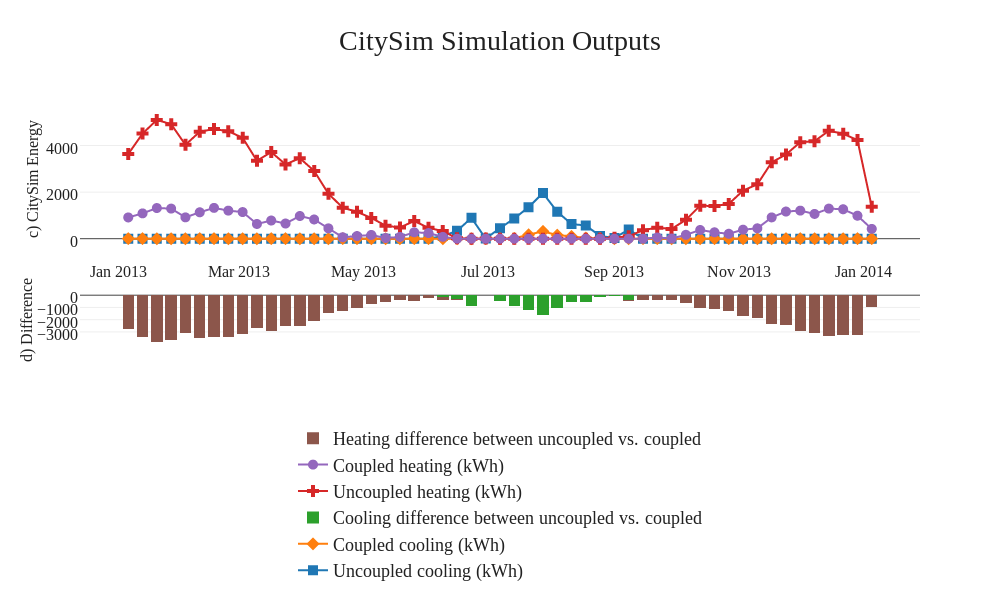
Claytonmiller's interactive graph and data of "CitySim Simulation Outputs" is a line chart, showing Uncoupled cooling (kWh), Coupled cooling (kWh), Cooling difference between uncoupled vs. coupled, Uncoupled heating (kWh), Coupled heating (kWh), Heating difference between uncoupled vs. coupled; with time in the x-axis and c) CitySim Energy in the y-axis.. The x-axis shows values from 1355385854203.0935 to 1390917345796.9065. The y-axis shows values from -555.4347590601966 to 5656.973759060196.