Edit chart
Loading graph
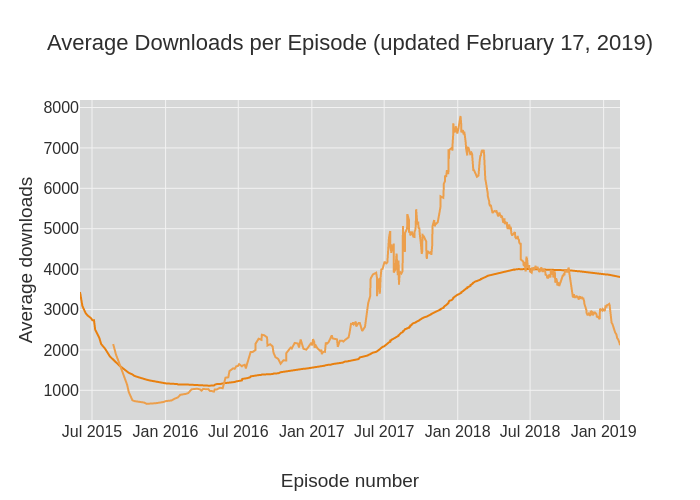
Coreypetty's interactive graph and data of "Average Downloads per Episode (updated February 17, 2019)" is a scatter chart, showing All Time Average vs Rolling Ave. (10 episodes); with Episode number in the x-axis and Average downloads in the y-axis.. The x-axis shows values from 0 to 0. The y-axis shows values from 0 to 0.