Edit chart
Loading graph
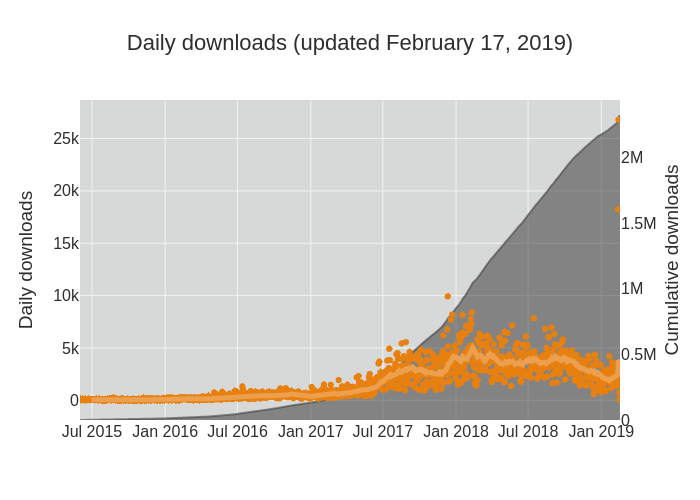
Coreypetty's interactive graph and data of "Daily downloads (updated February 17, 2019)" is a scatter chart, showing Daily, Cumulative, 30-day Ave.; with time in the x-axis and Daily downloads in the y-axis.. The x-axis shows values from 1433116800000 to 1550361600000. The y-axis shows values from 0 to 0.