Edit chart
Loading graph
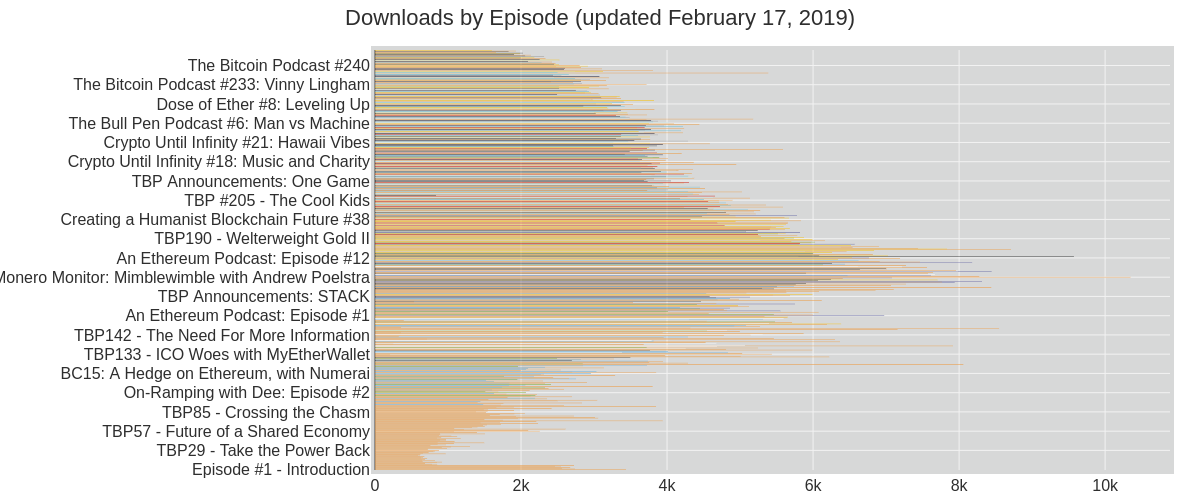
Coreypetty's interactive graph and data of "Downloads by Episode (updated February 17, 2019)" is a bar chart, showing LibSyn. The x-axis shows values from 0 to 0. The y-axis shows values from 0 to 0.