Edit chart
Loading graph
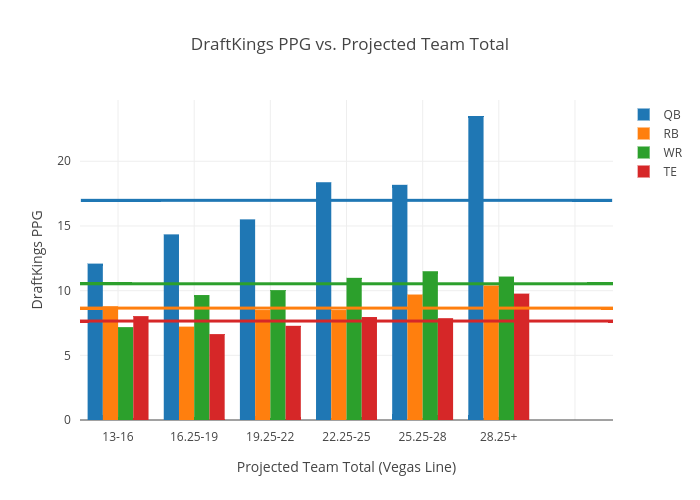
Dfsondemand's interactive graph and data of "DraftKings PPG vs. Projected Team Total" is a grouped bar chart, showing QB, RB, WR, TE; with Projected Team Total (Vegas Line) in the x-axis and DraftKings PPG in the y-axis.. The x-axis shows values from -0.5 to 6.5. The y-axis shows values from 0 to 24.736842105263158.