Edit chart
Loading graph
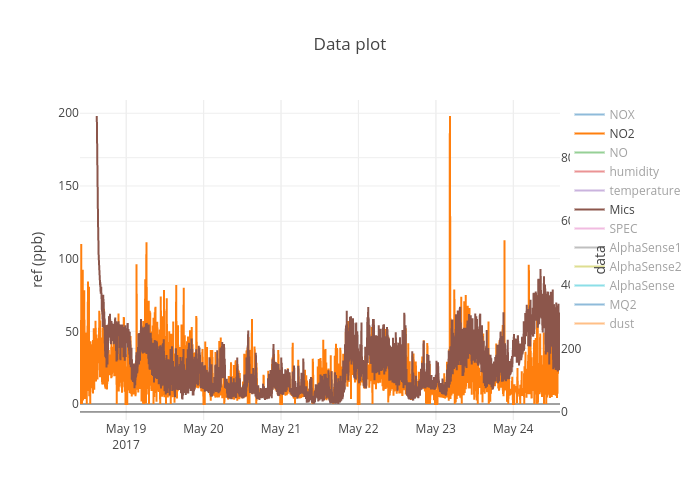
Dariosalvi's interactive graph and data of "Data plot" is a scatter chart, showing NOX, NO2, NO, humidity, temperature, Mics, SPEC, AlphaSense1, AlphaSense2, AlphaSense, MQ2, dust; with ref (ppb) in the y-axis. The x-axis shows values from 0 to 0. The y-axis shows values from 0 to 0.