Edit chart
Loading graph
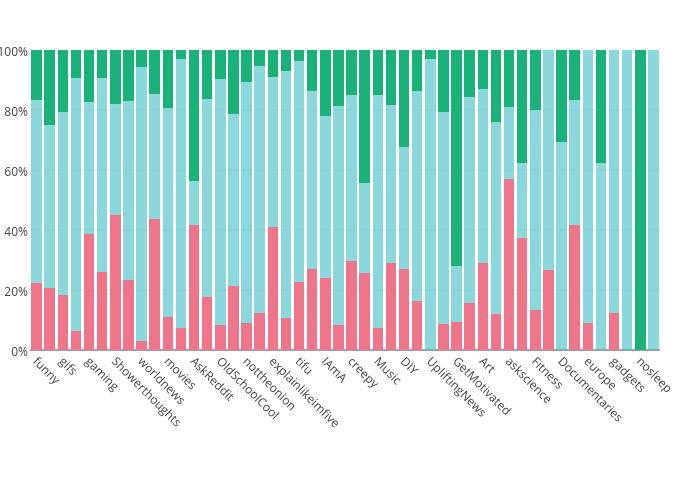
Datastoriesplots's interactive graph and data of "Negative, Neutral, Positive" is a stacked bar chart, showing Negative, Neutral, Positive. The x-axis shows values from -0.5 to 47.5. The y-axis shows values from 0 to 100.