Edit chart
Loading graph
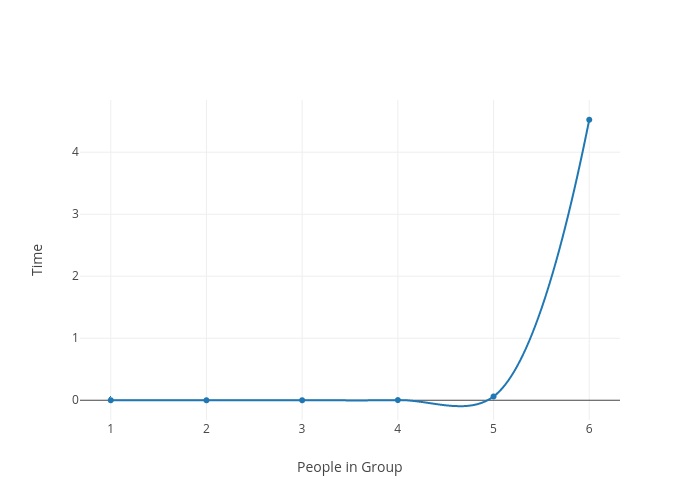
Datenstrom's interactive graph and data of "Time vs People in Group" is a line chart, showing Breadth-First; with People in Group in the x-axis and Time in the y-axis.. The x-axis shows values from 0 to 0. The y-axis shows values from 0 to 0.