Edit chart
Loading graph
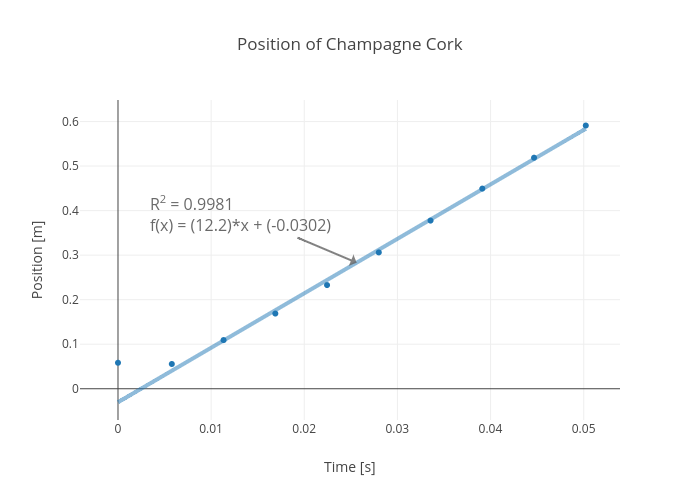
Davidpetro's interactive graph and data of "Position of Champagne Cork" is a scatter chart, showing Position [m] vs Position [m] - fit; with Time [s] in the x-axis and Position [m] in the y-axis.. The x-axis shows values from -0.004078145337339273 to 0.05389370238930911. The y-axis shows values from -0.07017484915537137 to 0.6483001733238803. This visualization has the following annotation: R2 = 0.9981f(x) = (12.2)*x + (-0.0302)