Edit chart
Loading graph
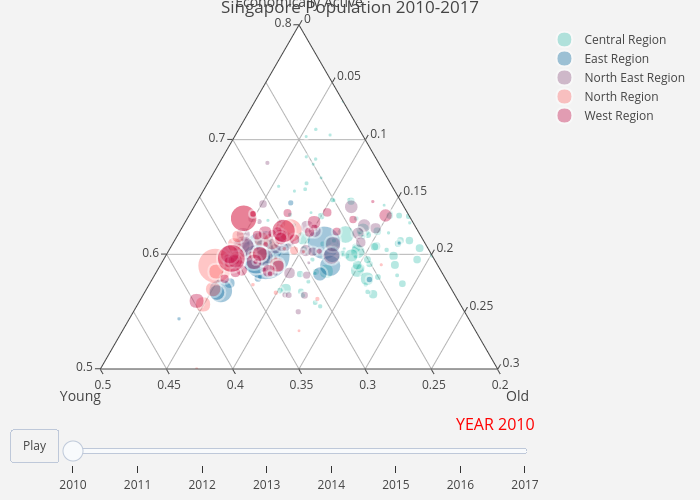
Davidten's interactive graph and data of "Singapore Population 2010-2017" is a scatterternary, showing Central Region, East Region, North East Region, North Region, West Region. The x-axis shows values from 0 to 0. The y-axis shows values from 0 to 0.