Edit chart
Loading graph
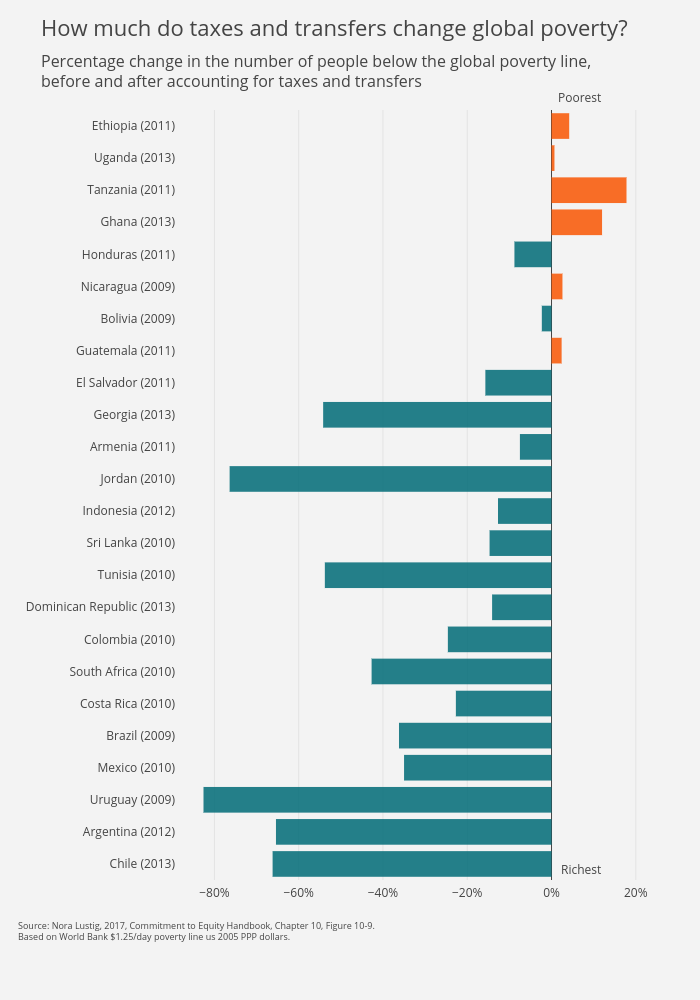
Divyanshi's interactive graph and data of "Poverty" is a bar chart, showing Poverty. The x-axis shows values from 0 to 0. The y-axis shows values from 0 to 0. This visualization has the following annotations: Richest; Poorest; Source: Nora Lustig, 2017, Commitment to Equity Handbook, Chapter 10, Figure 10-9.; Based on World Bank $1.25/day poverty line us 2005 PPP dollars.; How much do taxes and transfers change global poverty?; Percentage change in the number of people below the global poverty line,; before and after accounting for taxes and transfers