Edit chart
Loading graph
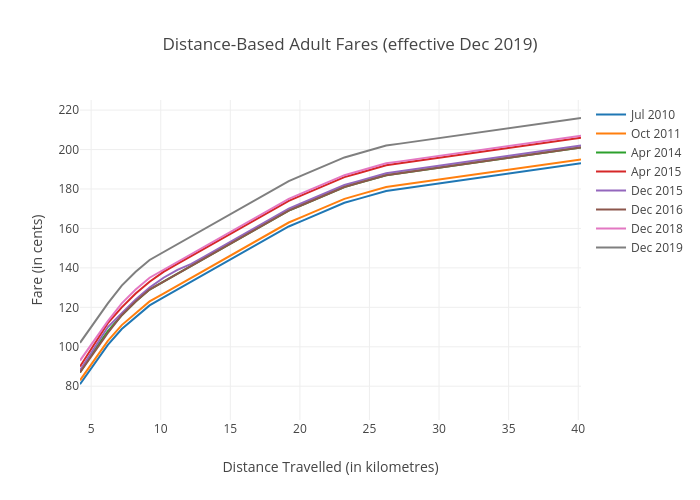
Doorsareclosing's interactive graph and data of "Distance-Based Adult Fares (effective Dec 2019)" is a line chart, showing Jul 2010, Oct 2011, Apr 2014, Apr 2015, Dec 2015, Dec 2016, Dec 2018, Dec 2019; with Distance Travelled (in kilometres) in the x-axis and Fare (in cents) in the y-axis.. The x-axis shows values from 4.2 to 40.2. The y-axis shows values from 62.888888888888886 to 225.11111111111111.