Edit chart
Loading graph
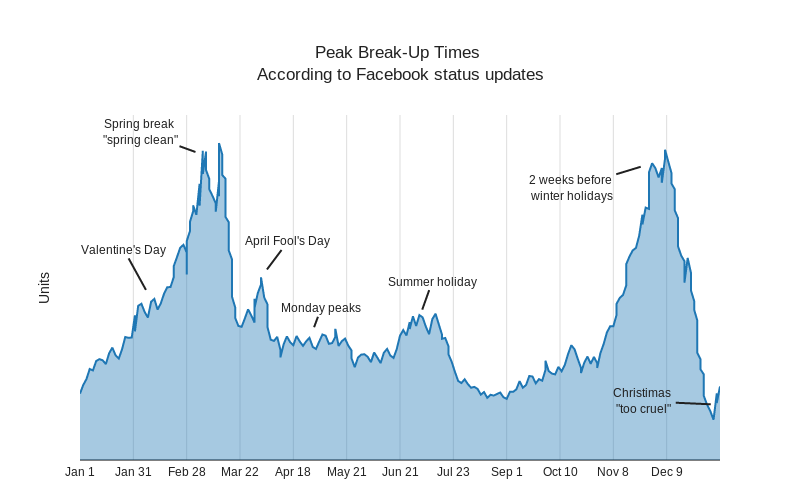
Dreamshot's interactive graph and data of "Peak Break-Up Times According to Facebook status updates" is a filled scatter chart, showing trace 0_y; with Units in the y-axis. The x-axis shows values from 0 to 198. The y-axis shows values from 0 to 96.86829703261319. This visualization has the following annotations: Valentine's Day; Spring break "spring clean"; April Fool's Day; Monday peaks; Summer holiday; 2 weeks before winter holidays; Christimas "too cruel"