Edit chart
Loading graph
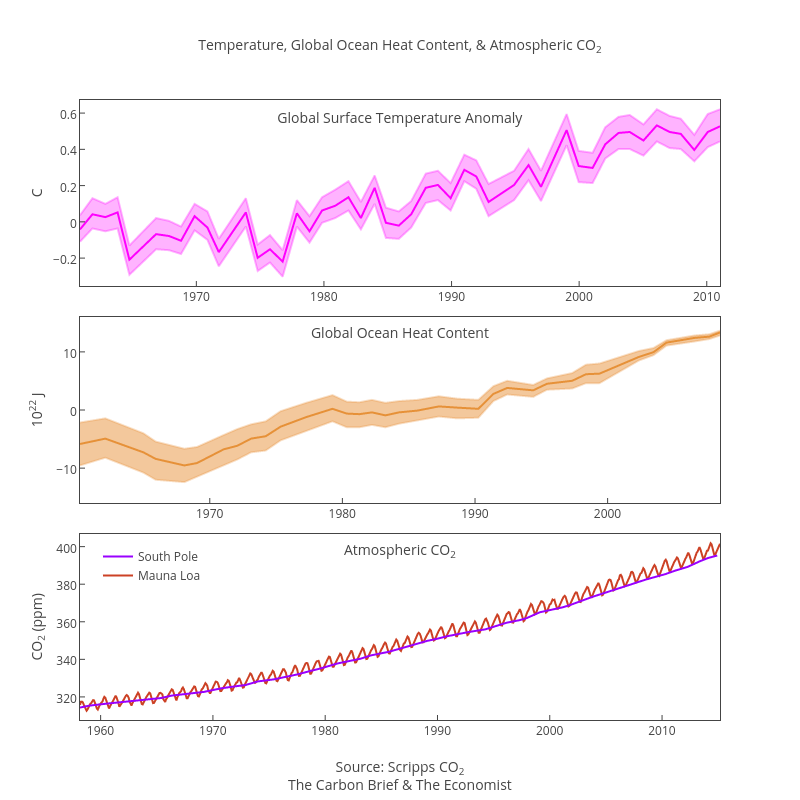
Dreamshot's interactive graph and data of "Temperature, Global Ocean Heat Content, & Atmospheric CO2Global Surface Temperature Anomaly" is a scatter chart, showing Mauna Loa, South Pole, Heat Content, +2 Standard Error, -2 Standard Error, Temperature Anomaly, -2 Standard Error, +2 Standard Error; with Source: Scripps CO2The Carbon Brief & The Economist in the x-axis and CO2 (ppm) in the y-axis.. The x-axis shows values from -373575600000 to 1425186000000. The y-axis shows values from 307.70944444444444 to 406.72055555555556.