Edit chart
Loading graph
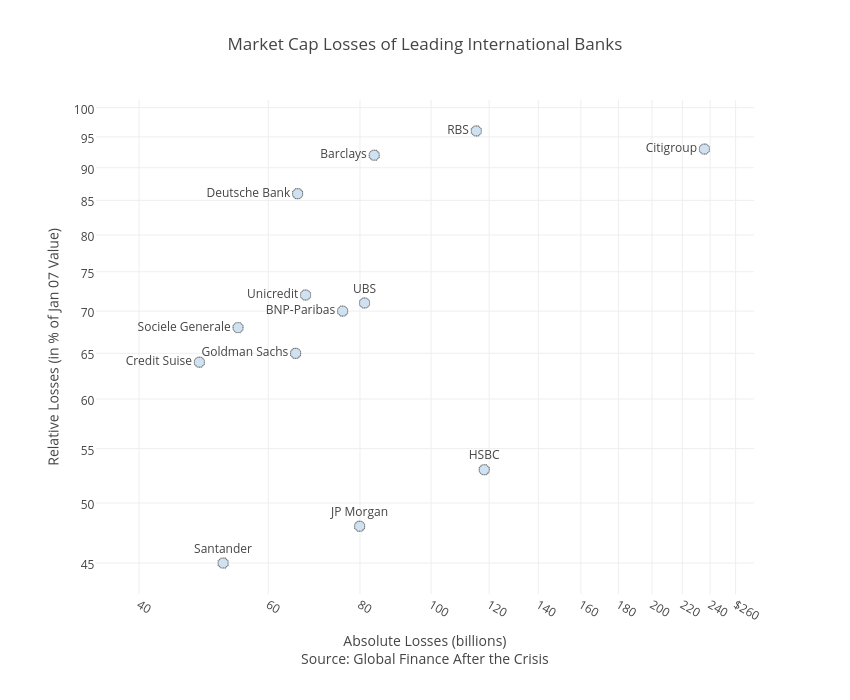
Dreamshot's interactive graph and data of "Market Cap Losses of Leading International Banks" is a , showing , , , , ; with Absolute Losses (billions)Source: Global Finance After the Crisis in the x-axis and Relative Losses (in % of Jan 07 Value) in the y-axis.. The x-axis shows values from 1.5440680443502754 to 2.4393326938302624. The y-axis shows values from 1.629643045223555 to 2.0058407015913566.