Edit chart
Loading graph
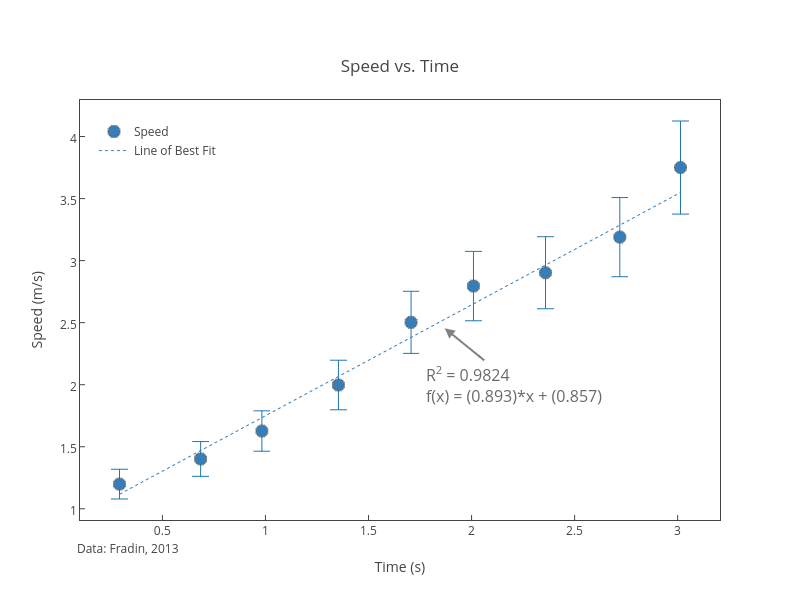
Dreamshot's interactive graph and data of "Speed vs. Time" is a scatter chartwith vertical error bars, showing Speed vs Line of Best Fit; with Time (s) in the x-axis and Speed (m/s) in the y-axis.. The x-axis shows values from 0.10008585586027557 to 3.205418731295688. The y-axis shows values from 0.9097557510612073 to 4.294306620566891. This visualization has the following annotations: Data: Fradin, 2013; R2 = 0.9824f(x) = (0.893)*x + (0.857)