Edit chart
Loading graph
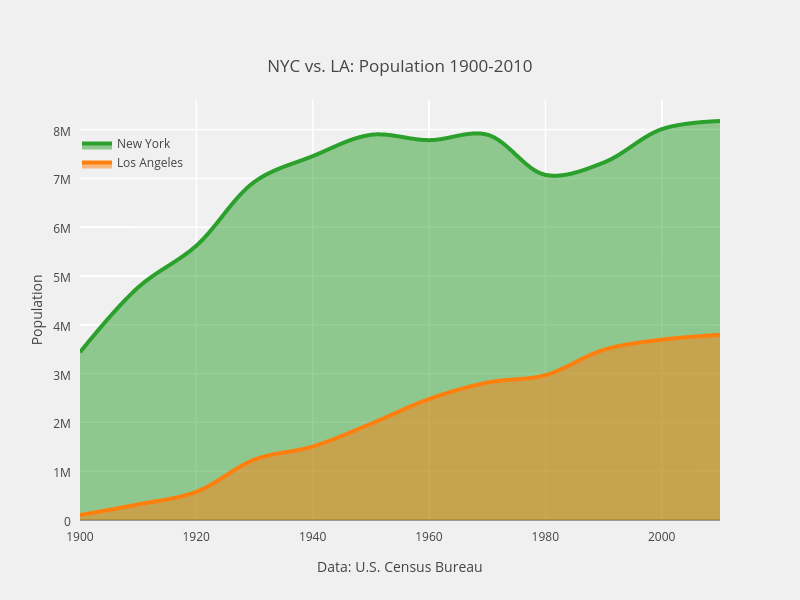
Dreamshot's interactive graph and data of "NYC vs. LA: Population 1900-2010" is a filled line chart, showing New York vs Los Angeles; with Data: U.S. Census Bureau in the x-axis and Population in the y-axis.. The x-axis shows values from 1900 to 2010. The y-axis shows values from 0 to 8605403.157894736.