Edit chart
Loading graph
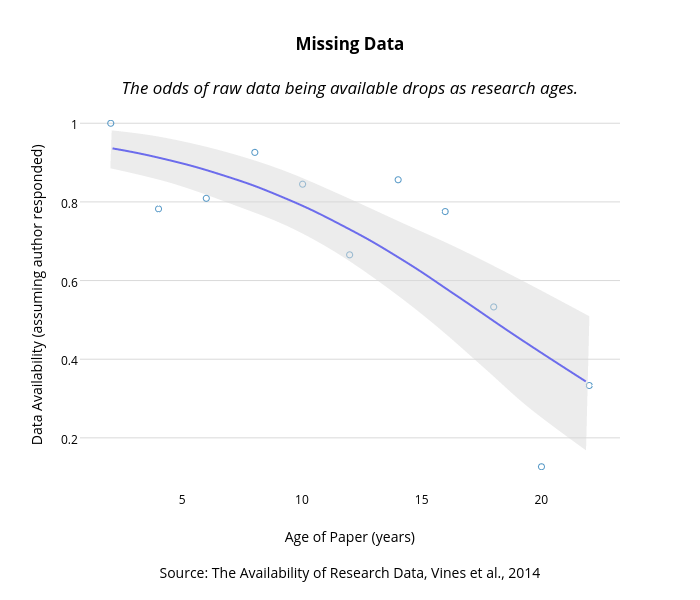
Dreamshot's interactive graph and data of "Missing DataThe odds of raw data being available drops as research ages." is a line chart, showing Best Fit, Research Article, 95% CI, 95% CI; with Age of Paper (years)Source: The Availability of Research Data, Vines et al., 2014 in the x-axis and Data Availability (assuming author responded) in the y-axis.. The x-axis shows values from 0.7216385664661524 to 23.280440435612853. The y-axis shows values from 0.0673734408911437 to 1.0591235650968804.