Edit chart
Loading graph
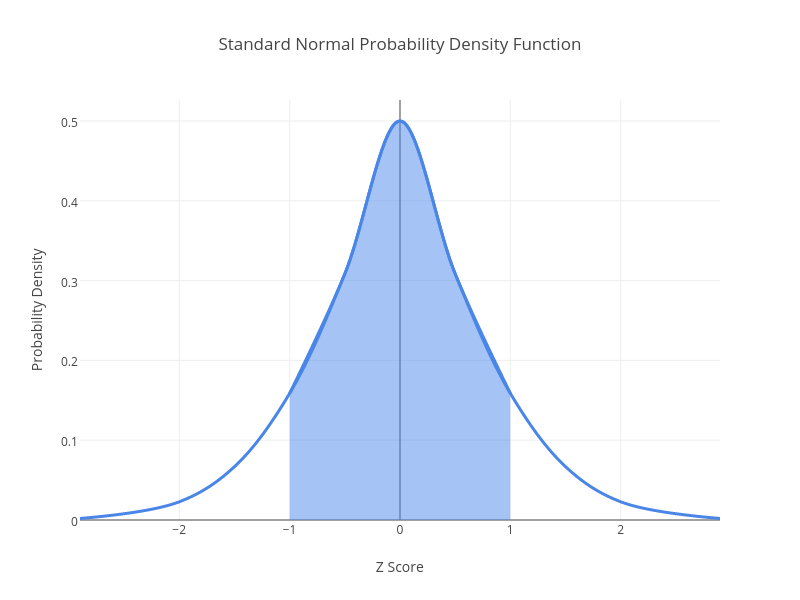
Dreamshot's interactive graph and data of "Standard Normal Probability Density Function" is a line chart, showing vs ; with Z Score in the x-axis and Probability Density in the y-axis.. The x-axis shows values from -2.9 to 2.9. The y-axis shows values from 0 to 0.5263157894736842.