Edit chart
Loading graph
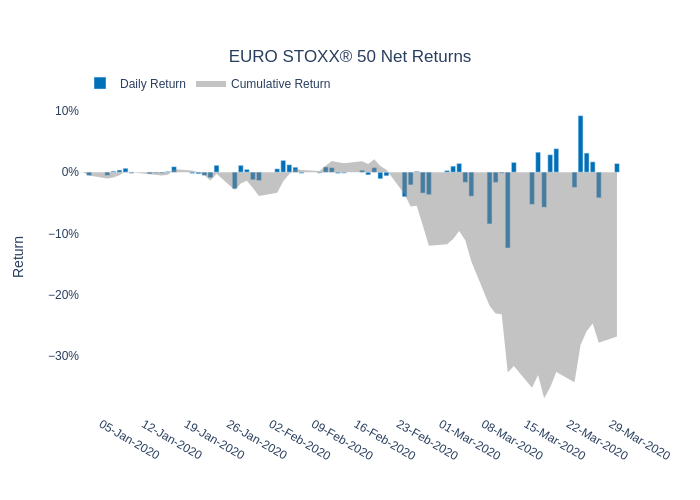
Ecincotta's interactive graph and data of "EURO STOXX® 50 Net Returns" is a bar chart, showing Daily Return vs Cumulative Return; with Return in the y-axis. The x-axis shows values from 0 to 0. The y-axis shows values from 0 to 0.