Edit chart
Loading graph
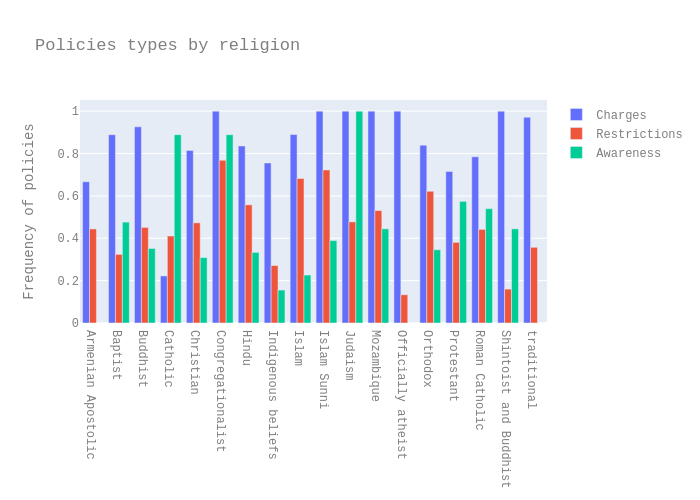
Epflturner's interactive graph and data of "Policies types by religion" is a bar chart, showing Charges, Restrictions, Awareness; with Frequency of policies in the y-axis. The x-axis shows values from 0 to 0. The y-axis shows values from 0 to 0.