Edit chart
Loading graph
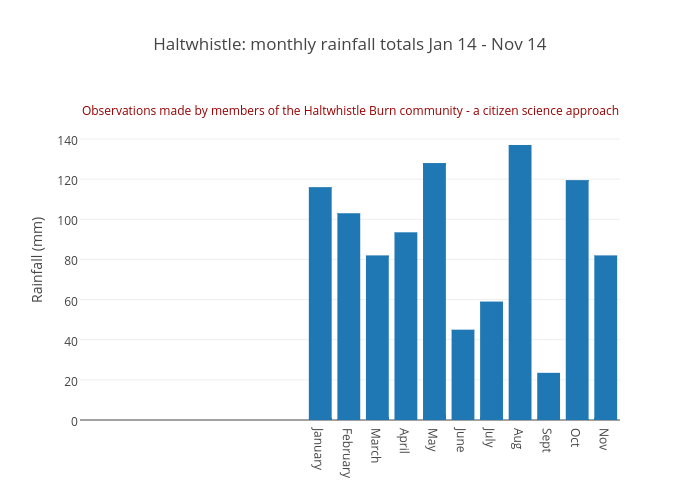
Eleanorstarkey's interactive graph and data of "Haltwhistle: monthly rainfall totals Jan 14 - Nov 14" is a bar chart, showing Col2; with Rainfall (mm) in the y-axis. The x-axis shows values from -0.5 to 10.5. The y-axis shows values from 0 to 144.21052631578948. This visualization has the following annotation: Observations made by members of the Haltwhistle Burn community - a citizen science approach