Edit chart
Loading graph
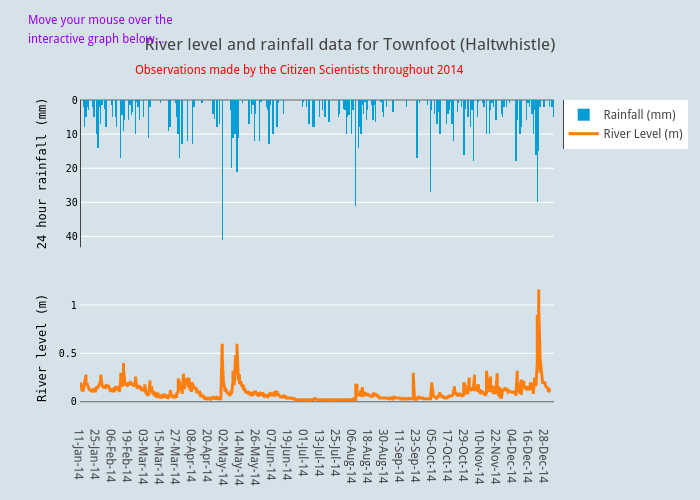
Eleanorstarkey's interactive graph and data of "River level and rainfall data for Townfoot (Haltwhistle)" is a scatter chart, showing River Level (m) vs Rainfall (mm); with River level (m) in the y-axis. The x-axis shows values from -0.5 to 354.5. The y-axis shows values from -0.1887348547822363 to 1.3. This visualization has the following annotations: Observations made by the Citizen Scientists throughout 2014; Move your mouse over the; interactive graph below...