Edit chart
Loading graph
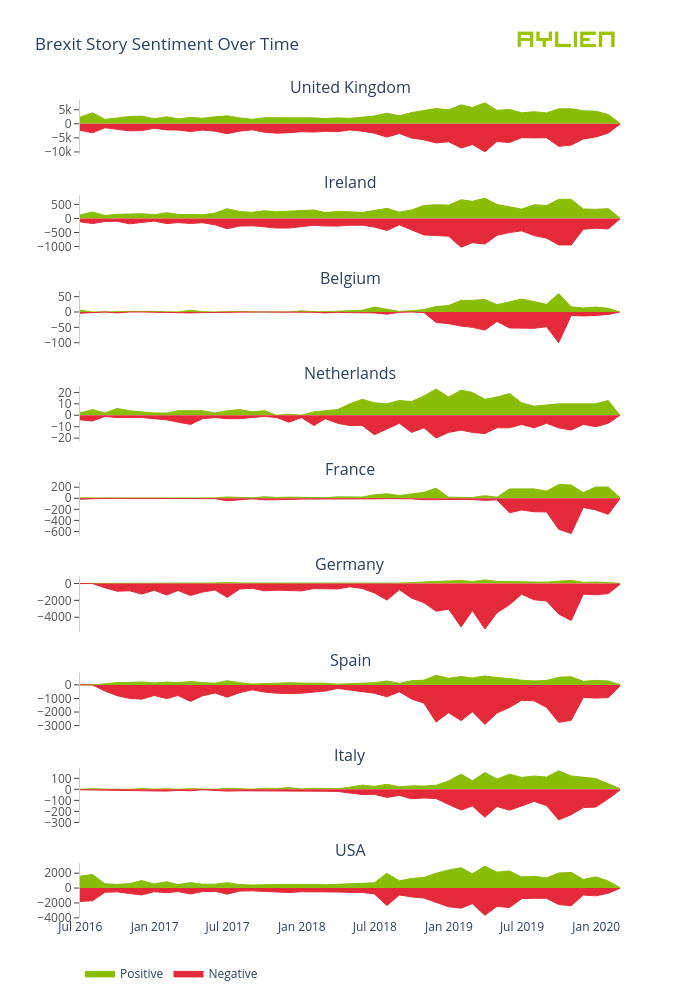
Eoinmgb's interactive graph and data of "Brexit Story Sentiment Over Time" is a filled line chart, showing Positive, Negative, Positive, Negative, Positive, Negative, Positive, Negative, Positive, Negative, Positive, Negative, Positive, Negative, Positive, Negative, Positive, Negative. The x-axis shows values from 0 to 0. The y-axis shows values from 0 to 0. This visualization has the following annotations: United Kingdom; Ireland; Belgium; Netherlands; France; Germany; Spain; Italy; USA