Edit chart
Loading graph
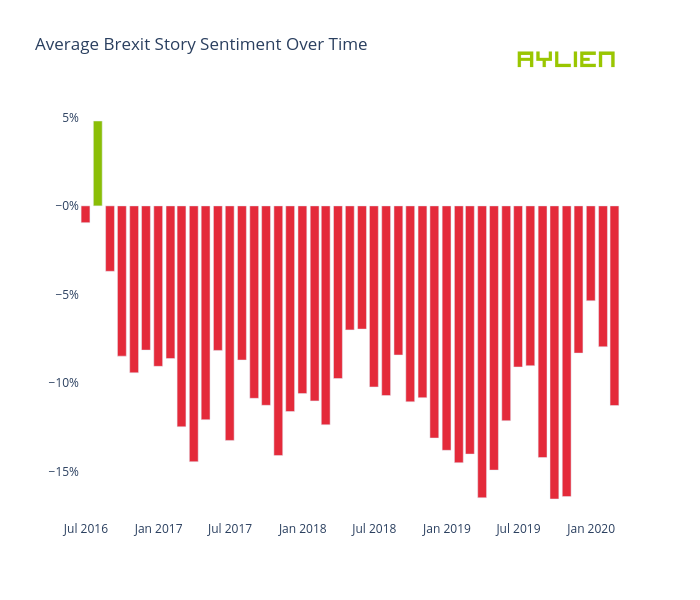
Eoinmgb's interactive graph and data of "Average Brexit Story Sentiment Over Time" is a bar chart, showing Positive vs Negative. The x-axis shows values from 0 to 0. The y-axis shows values from 0 to 0.