Edit chart
Loading graph
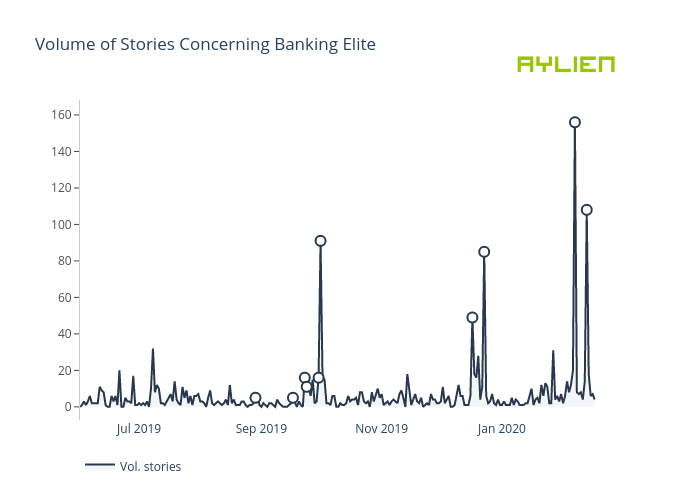
Eoinmgb's interactive graph and data of "Volume of Stories Concerning Banking Elite" is a filled line chart, showing Vol. stories. The x-axis shows values from 0 to 0. The y-axis shows values from 0 to 0.