Edit chart
Loading graph
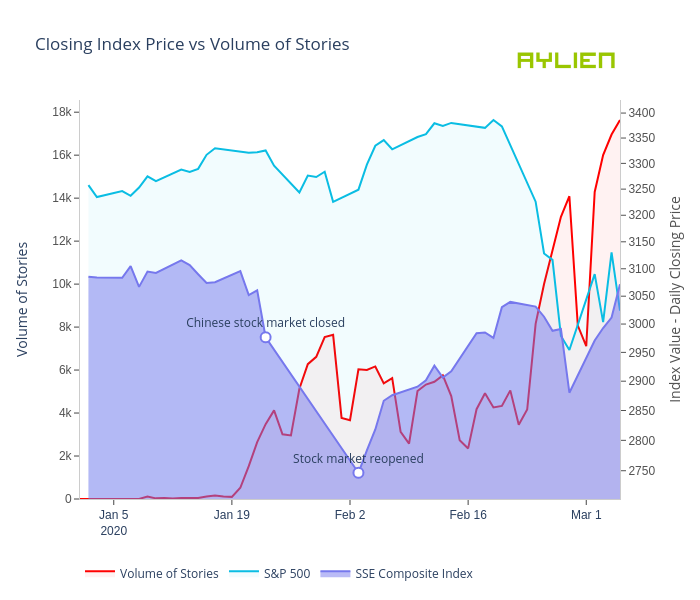
Eoinmgb's interactive graph and data of "Closing Index Price vs Volume of Stories" is a filled line chart, showing Volume of Stories, S&P 500, SSE Composite Index, SSE Composite Index; with Volume of Stories in the y-axis. The x-axis shows values from 0 to 0. The y-axis shows values from 0 to 0.