Edit chart
Loading graph
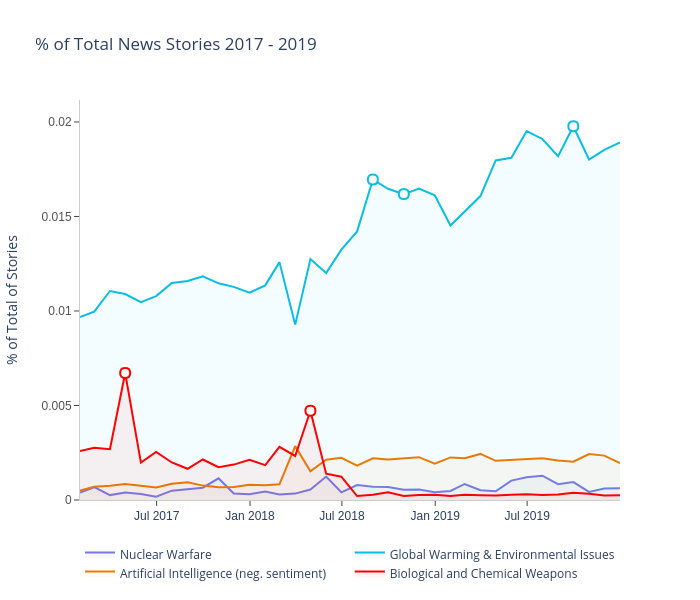
Eoinmgb's interactive graph and data of "% of Total News Stories 2017 - 2019" is a filled line chart, showing Nuclear Warfare, Global Warming & Environmental Issues, Artificial Intelligence (neg. sentiment), Biological and Chemical Weapons; with % of Total of Stories in the y-axis. The x-axis shows values from 0 to 0. The y-axis shows values from 0 to 0.