Edit chart
Loading graph
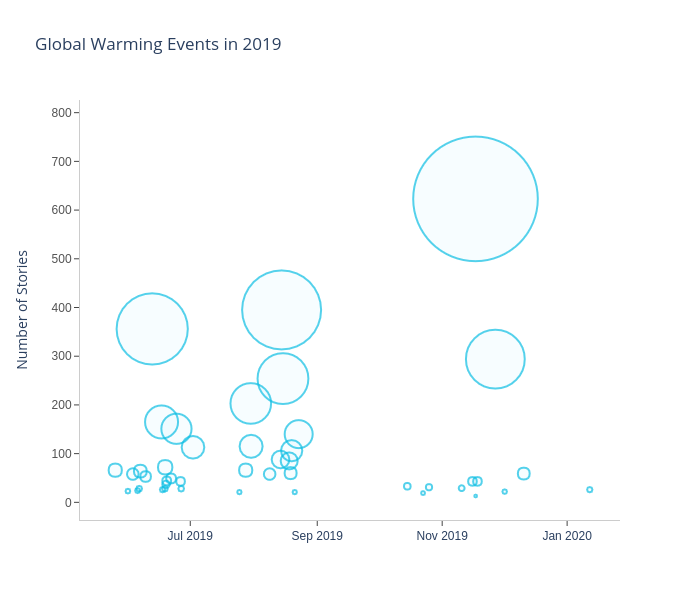
Eoinmgb's interactive graph and data of "Global Warming Events in 2019" is a scatter chart, showing Story Clusters; with Number of Stories in the y-axis. The x-axis shows values from 0 to 0. The y-axis shows values from 0 to 0.