Edit chart
Loading graph
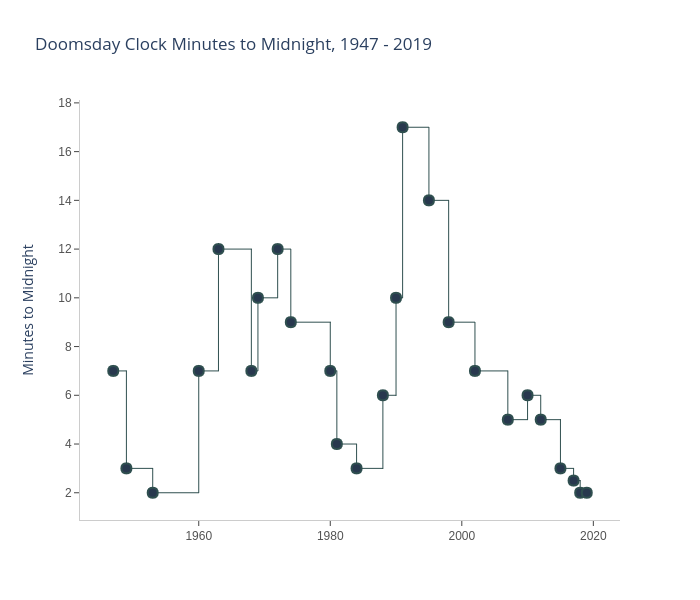
Eoinmgb's interactive graph and data of "Doomsday Clock Minutes to Midnight, 1947 - 2019" is a line chart, showing Minues to Midnight vs Minues to Midnight; with Minutes to Midnight in the y-axis. The x-axis shows values from 0 to 0. The y-axis shows values from 0 to 0.