Edit chart
Loading graph
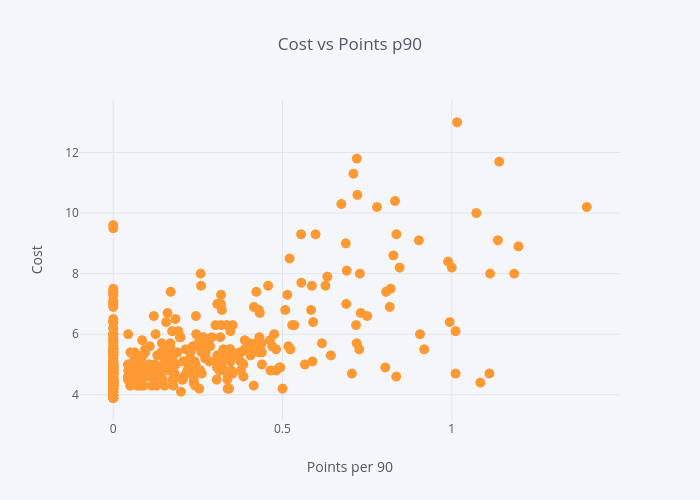
Fcpython's interactive graph and data of "Cost vs Points p90" is a scatter chart, showing now_cost; with Points per 90 in the x-axis and Cost in the y-axis.. The x-axis shows values from -0.08940865054928304 to 1.488093647549283. The y-axis shows values from 3.228099499868386 to 13.671900500131613.