Edit chart
Loading graph
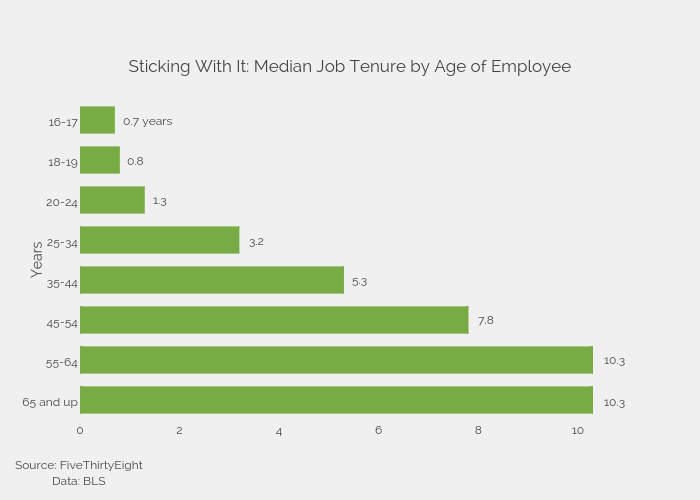
Fivethirtyeight's interactive graph and data of "Sticking With It: Median Job Tenure by Age of Employee" is a bar chart, showing years; with Years in the y-axis. The x-axis shows values from 0 to 10.842105263157896. The y-axis shows values from -0.5 to 7.5. This visualization has the following annotations: 0.7 years; 0.8; 1.3; 3.2; 5.3; 7.8; 10.3; 10.3; Source: FiveThirtyEightData: BLS