Edit chart
Loading graph
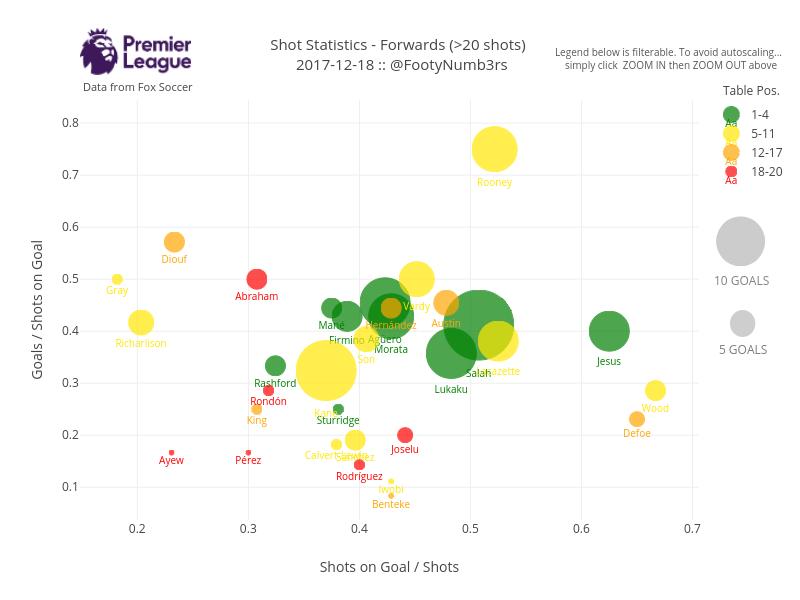
Footynumb3rs.'s interactive graph and data of "Shot Statistics - Forwards (>20 shots) 2017-12-18 :: @FootyNumb3rs" is a , showing 1-4, 5-11, 12-17, 18-20; with Shots on Goal / Shots in the x-axis and Goals / Shots on Goal in the y-axis.. The x-axis shows values from 0.14831513800585963 to 0.7057985820872418. The y-axis shows values from 0.03695025234318672 to 0.844448449891853. This visualization has the following annotations: 10 GOALS; 5 GOALS; Table Pos.; Data from Fox Soccer; Legend below is filterable. To avoid autoscaling... <br> simply click ZOOM IN then ZOOM OUT above