Edit chart
Loading graph
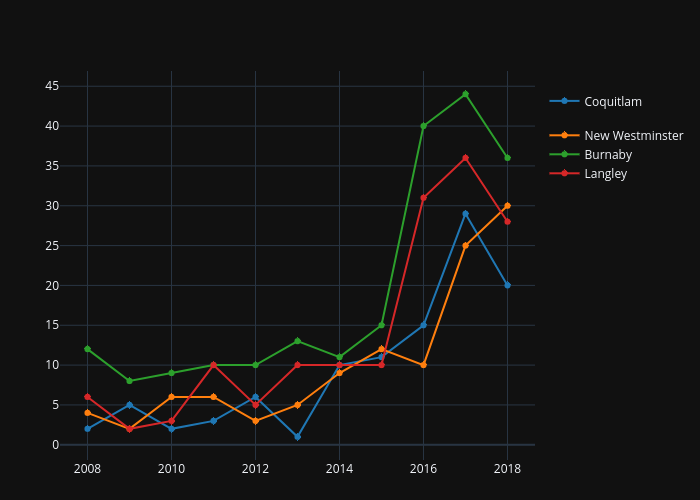
Garyrobert's interactive graph and data of "Illicit Drug Overdose Deaths (2008 to Nov. 2018)" is a line chart, showing Coquitlam, New Westminster, Burnaby, Langley; with in the x-axis and in the y-axis.. The x-axis shows values from 2007.3570379693729 to 2018.6429620306271. The y-axis shows values from -1.7946105072463765 to 46.794610507246375.