Edit chart
Loading graph
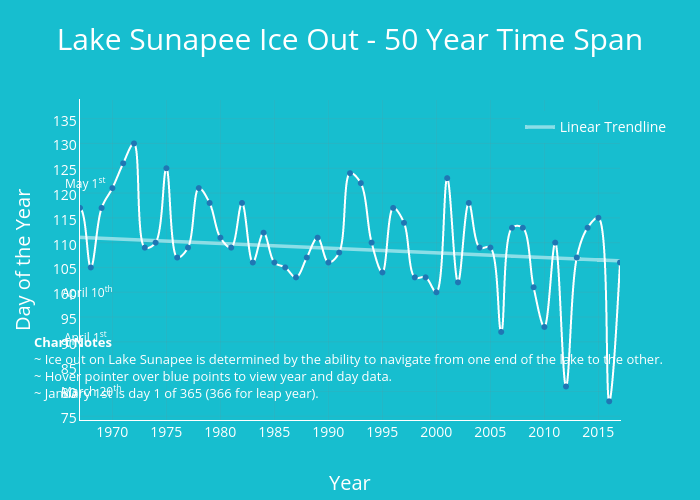
Geoff63's interactive graph and data of "Lake Sunapee Ice Out - 50 Year Time Span" is a line chart, showing Day of Year, Linear Trendline, Day of Year; with Year in the x-axis and Day of the Year in the y-axis.. The x-axis shows values from 1967 to 2017. The y-axis shows values from 74.23313115996967 to 138.76686884003033. This visualization has the following annotations: April 1st; May 1st; March 20th; Chart Notes~ Ice out on Lake Sunapee is determined by the ability to navigate from one end of the lake to the other. ~ Hover pointer over blue points to view year and day data.~ January 1st is day 1 of 365 (366 for leap year). ; April 10th