Edit chart
Loading graph
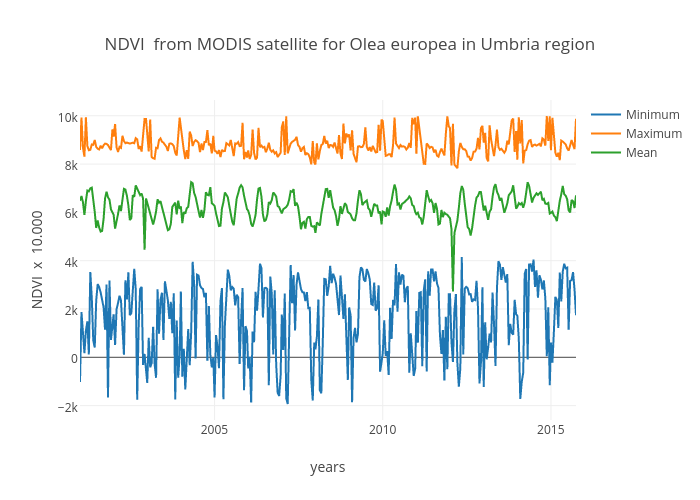
Gianlucamassei's interactive graph and data of "NDVI from MODIS satellite for Olea europea in Umbria region" is a scatter chart, showing Minimum, Maximum, Mean; with years in the x-axis and NDVI x 10.000 in the y-axis.. The x-axis shows values from 978303600000 to 1443564000000. The y-axis shows values from -2596.5 to 10653.5.