Edit chart
Loading graph
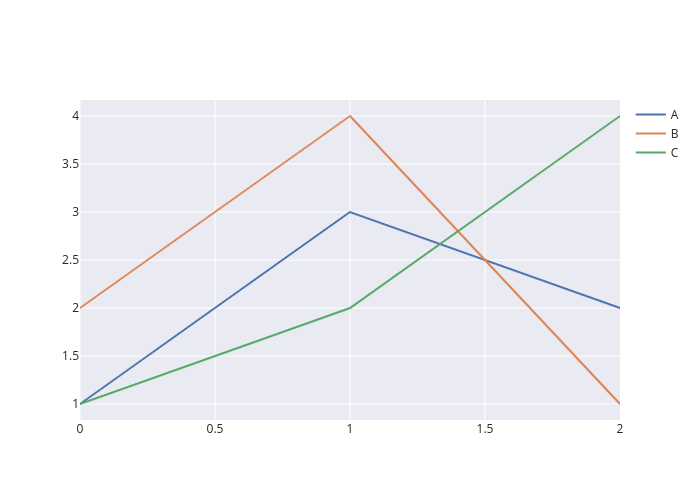
Helve's interactive graph and data of "A, B, C" is a line chart, showing A, B, C. The x-axis shows values from 0 to 2. The y-axis shows values from 0.8333333333333333 to 4.166666666666667.