Edit chart
Loading graph
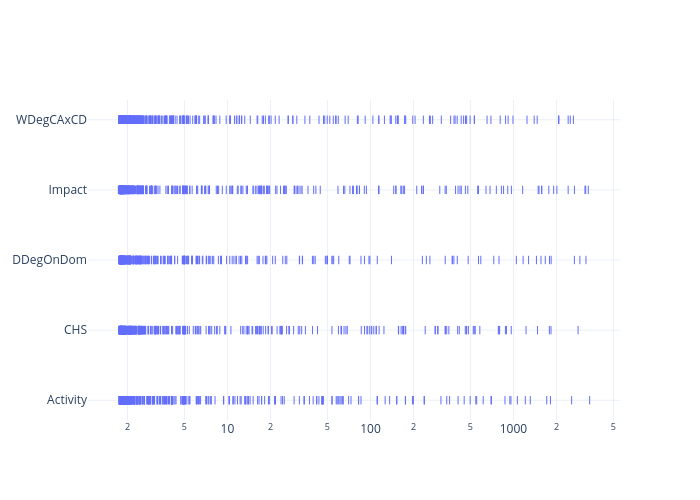
Hugueswattez's interactive graph and data is a scatter chart. The x-axis shows values from 0.03048027330936745 to 3.7394239050453866. The y-axis shows values from -0.29981378026070765 to 4.299813780260708.