Edit chart
Loading graph
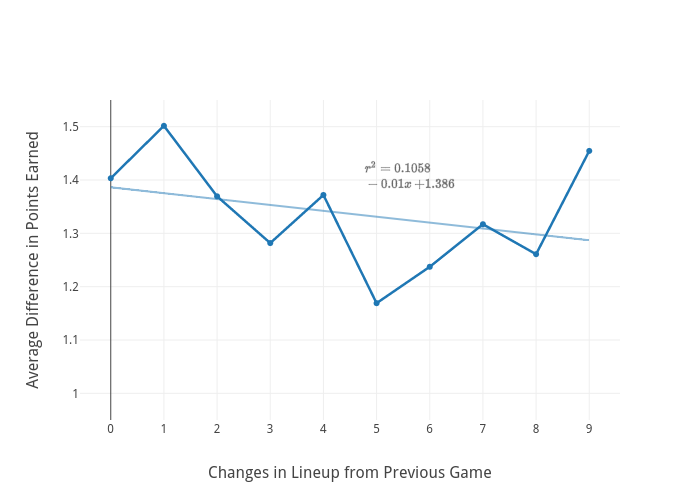
Ike348's interactive graph and data of "Average Difference in Points Earned vs Changes in Lineup from Previous Game" is a line chart, showing D; with Changes in Lineup from Previous Game in the x-axis and Average Difference in Points Earned in the y-axis.. The x-axis shows values from -0.5763591936469151 to 9.576359193646915. The y-axis shows values from 0.95 to 1.55. This visualization has the following annotation: $r^2 = 0.1058\\-0.01x+1.386$